by Giovanni Diana and Diana Passaro
Update
- Last update, 07-05-2020
- 26 Mar 2020: The repository CSSEGISandData/COVID-19 is currently making major changes in the data structure.
Introduction
Spread of COVID-19 in early 2020 has raised important concerns about the ability of national health systems to detect the positive cases, as well as the intervention rate a country is expected to put in place to contain the infection.
Using data on disease spread and containment through the public repository CSSEGISandData/COVID-19 we applied statistical inference to predict the course of the infection using two models of the outbreak.
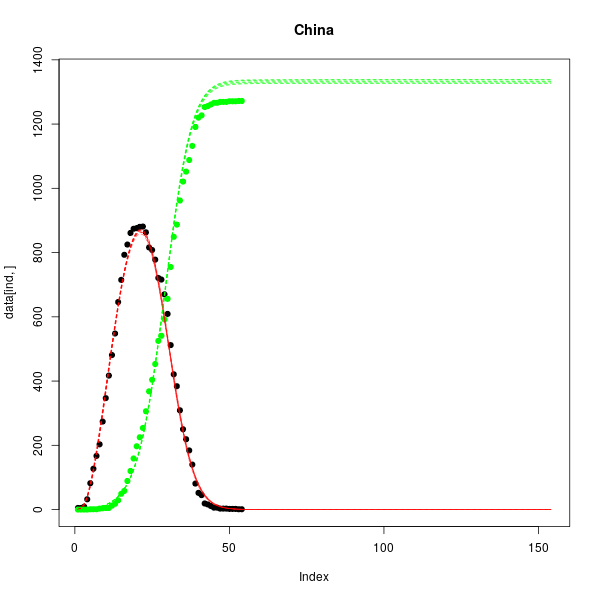
In some regions of China the infection rate has significantly decreased compared to the initial exponential spread of the infection. This information can be used to estimate the spread progression in other countries.
First, we introduce a minimal heuristic model of the number of infections based on the disease outbreak in China. This model captures the initial exponential phase of the outbreak and the effect of the external intervention to contain the infection. Next we extend the SIR model employed to describe susceptible, infected and recovered populations to account for external interventaions.
For both models we employ Bayesian inference to determine model parameters and generate predictions of the future evolution of the infection.
Worldwide analysis
For this analysis we assume that infection and recovery rates in the absence of external intervention are the same for all countries whereas all the other model parameters are country-dependent. This allows us to exploit the worldwide data to strengthen the predictive power of both models.
The framework of statistical inference allows us to estimate model parameters and make predictions while taking into account statistical uncertainties derived from the data and the prior uncertainty. We performed a global analysis on the areas included in the CSSE dataset [1].
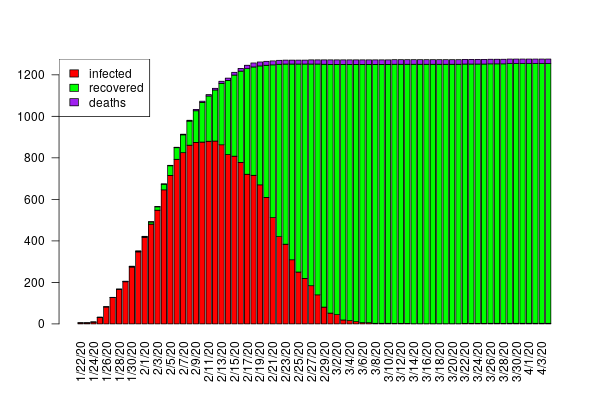
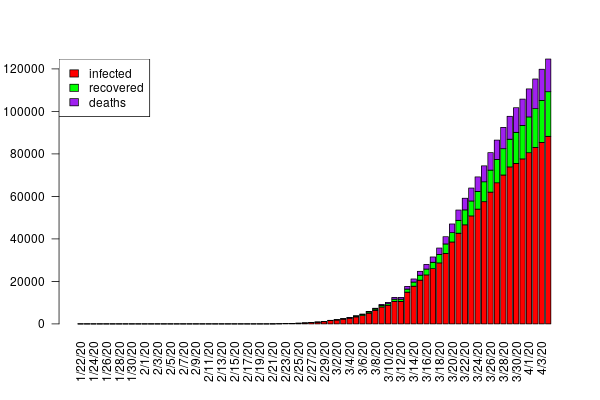
The interactive charts below give an overview of the course of the infection for each country for the two models employed. On the left, predictions based on the heuristic model show the dynamics of the infection rate with the 90% confidence interval (red curves). On the right, the dynamics of infection (red curves) obtained with the SIR model, which includes additional features such as the recovery rate (green curves). Data are updated every day.
Interactive chart 2: SIR model predictions. Infected (red) and recovered (green) populations. Dots are data, shaded areas denote the 90% credible interval.
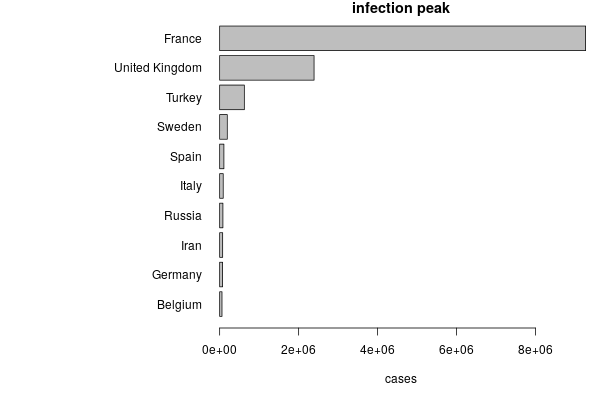
While China is now at the final stage of the spread, several countries in Europe are now facing the exponential phase. By quantifying the number of infected individual at the peak predicted by our model we found that Italy, Germany, France and Iran are at high risk of pandemic spread. During the exponential phase it is really hard to draw reliable estimates of when the diffusion of the virus will start displaying a reduction, therefore it is extremely important for these countries to strenghten the interventions to contain the eponential increase of new cases.
SIR model
In this section we introduce the SIR model to describe susceptible, infected and recovered individuals in a population. The intervention is accounted in two ways, first by reducing the infection rate $\beta$, and second by increasing the recovery rate $\gamma$. The first effect is due to restriction in social activity, reducing the probability of being infected, the second is due to the treatment of patients in hospitals which might improve over time.
The model is characterized by the following population dynamics
where $S$, $I$ and $R$ are the susceptible, infected and recovered population respectively. In order to include the effect of the intervention we parameterized the time dependency of the infection rate $\beta$ and the recovery rate $\gamma$ using the Hill functions
Note that the main difference with respect to the empirical model described in the previous section where the intervention had its own dynamical equation whereas here the time dependency is entirely modeled by the Hill functions. To include the effect of introducing tests for COVID-19 infection we modeled the observed numbers of infections and recovery as
with
| name | description |
|---|---|
| $S$ | Susceptible population |
| $I$ | Infected population |
| $R$ | Recovered population |
| $\beta$ | time-dependent infection rate |
| $\gamma$ | time-dependent recovery rate |
| $\nu$ | Observed fraction of cases |
Table 2: Summary of parameters and variable used in the SIR model.
Statistical inference and model predictions
By using the available daily reported cases in the public repository CSSEGISandData/COVID-19 we can estimate the parameters of both the heuristic model and the SIR model from the data for each country/region affected by the infection (see current state here). Knowing the model parameters allow us to draw predictions on how the epidemics will evolve.
Parameter estimation in individual areas
The framework of Bayesian statistics allows us to estimate the parameters of our model and their uncertainty by targeting their posterior distributions, namely their probability density conditional to the observed data. The uncertainty in the parameters propagates to the predicted dynamics of the infection, giving a way to explore the scenarios which are statistically compatible with the data.
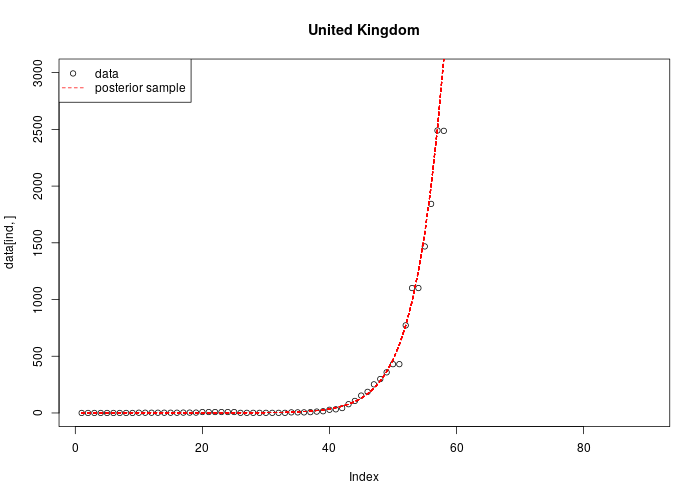
Here we used the Markov-chain monte carlo (MCMC) approach which allows us to draw posterior samples of the parameters. We can apply this method to individual countries affected by COVID-19 outbreak and extract country-specific model parameters as shown below in the case of the UK, where no specific interventions have been applied to date. As a consequence, the exponential phase generates a pronounced uncertainty in the model prediction of the future number of infected individuals.
Additional figures
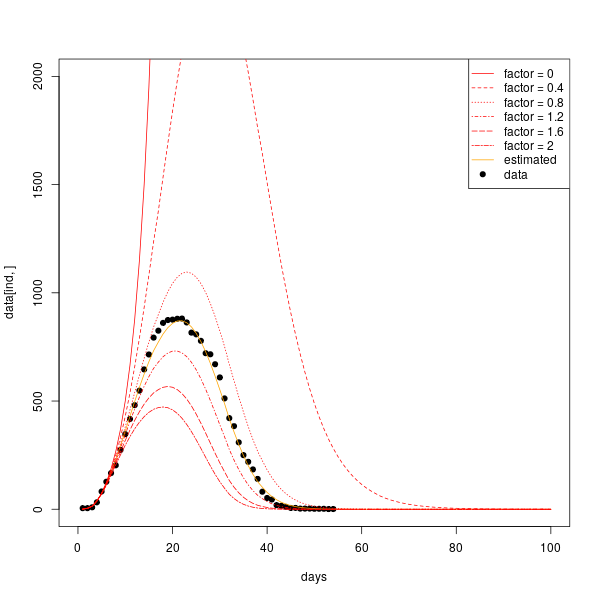
The intervention coefficient is estimated from each country from the data and is a fundamental parameter to bring down the peak of infected individuals, as it is shown by testing different values of $h$ from the estimated one.
References
- Dong, Ensheng, Hongru Du, and Lauren Gardner. “An interactive web-based dashboard to track COVID-19 in real time.” The Lancet Infectious Diseases (2020).